How to Remote Debug a .NET App in a Windows Docker Container
Let’s say you’ve moved a .NET Framework app into a Docker container running on Windows (not .NET Core). It’s running but you’ve noticed a bug you’ve not seen before. You can’t replicate it on your machine so it must be something in the container. Here’s how to debug it.
Step 1 - Install the remote debug tools in your image
Assuming you’ve scripted your image creation with a dockerfile, you’ll need to add the following steps:
# install the remote debugger
EXPOSE 4020 4021
RUN Invoke-WebRequest -OutFile c:\rtools_setup_x64.exe -Uri http://download.microsoft.com/download/1/2/2/1225c23d-3599-48c9-a314-f7d631f43241/rtools_setup_x64.exe;
RUN & 'c:\rtools_setup_x64.exe' /install /quiet
Then run docker build to create a fresh image.
Note that the URL shown above is for the 64-bit VS2015 remote tools. For other versions of the tools you’ll need to find the appropriate URL.
(Tip: Use your browser’s tools to follow the redirects when you click the download link on the Microsoft page to see what the actual file URL is)
Step 2 - Run the container
Just use docker run as you would normally, but include -p 4020:4020 -p 4021:4021 in the command to map the ports that the remote debugger uses.
For older versions of the remote tools, the ports are different. See the MSDN docs for more information.
Step 3 - Use docker exec
Now for the fun bit. The container is running and we decide we want to debug an application running in it.
You’ll need to get the id/name of the container you’re interested in.
Once you’ve got it go the the command line and run
docker exec -it <id/name> "C:\Program Files\Microsoft Visual Studio 14.0\Common7\IDE\Remote Debugger\x64\msvsmon.exe" /nostatus /silent /noauth /anyuser /nosecuritywarn
This will start the remote debugger. You’ll notice that the attached terminal will appear to hang at this point. This is because msvsmon doesn’t exit immediately - it waits until there are no more connections (or until you manually stop it).
Be aware that we’ve configured the debugger to allow any user to connect and we have disabled authorisation checks. When running on your local development machine I don’t expect this will be a major concern, but it is potentially unsafe and I do want to make sure you realise there are risks.
I would NOT recommend you do this in production. Then again, I don’t recommend attaching debuggers to production instances under any circumstances.
Oh, if you prefer, you could also vary this approach and run a powershell or cmd prompt via the EXEC command and, once connected, run msvsmon from that prompt. It’s up to you, though I prefer the first approach.
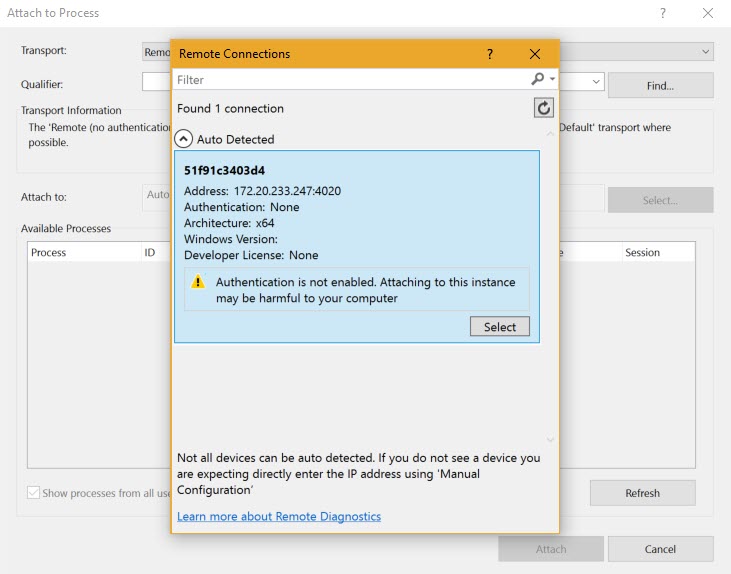
Step 4 - Attach to the machine from Visual Studio
Attach to the container as you would any other remote machine. When you click the Find button, the container should be detected. As you can see the container id is used as the machine name, making it easy to identify which container to connect to when you’re running multiple containers.
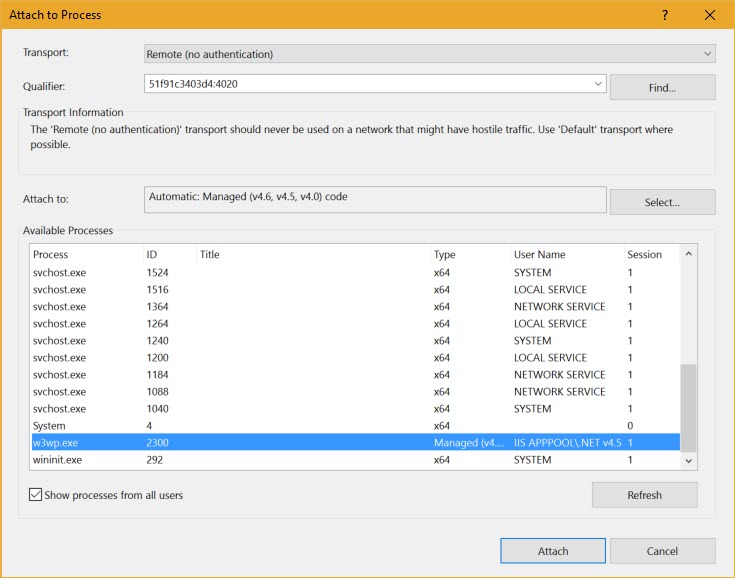
Now you can go ahead an debug your application like you would any other .NET application.
Sweet!!
Step 5 - Detach the exec console (optional)
By the way, because msvsmon will stay running, if you want your command prompt back you can press ctrl+p ctrl+q to detach the terminal.
Since msvsmon is running with no auth enabled it should timeout and close after 15 minutes of inactivity. You can adjust the command line parameters to alter the timeout period if you prefer.
That’s it! I hope you find that useful. If you iterate on the idea and improve it, drop me a tweet. I’d love to hear about it!