What’s Visual Studio’s Code Map All About?
In Visual Studio 2012 Update 1 (VS 2012.1) Microsoft delivered a feature for the Ultimate edition called Code Map with the goal of visualising relationships in code.
In Visual Studio 2012 Update 2 (VS 2012.2) they’ve extended the Code Map experience to include debugging support and the ability to generate code maps on the fly as a debugging session is conducted.
If you saw the announcement then you may have had one of the following reactions. Reaction 1 would be something like “Oh. It’s in Ultimate. I don’t have it. I’ll ignore it”. The second might be similar to mine: “Is this really going to be that useful?”. After ignoring it for a bit I decided to answer that question for myself.
For the purposes of this post, I’m used the excellent RestSharp project. You can grab it from https://github.com/restsharp/RestSharp. Oh, if you’re not aware of what it does, it’s a library that help’s you build REST based client and server applications by taking away a lot of the plumbing work you would otherwise have to do.
Getting Started
To start begin by asking a simple question. How does RestSharp make a client request? I’d never looked at the internals of RestSharp before so I wasn’t sure where to look.
Fortunately RestSharp comes with a set of unit and integration tests that I could use to explore the code with. I started with the integration tests and tried to find a suitable test in there to use and came across the Handles_Non_Existent_Domain() test. That seems a reasonable place to start. Note that if you want to follow along at home you’ll need the XUnit.Net Test Runner for Visual Studio 2012 extension installed since the tests are written for xUnit.
First thing to do? Set a breakpoint on the first line of the Handles_Non_Existent_Domain() test and start debugging the test. When the breakpoint is hit open a Code Map for the debugging session by either clicking the button in the toolbar (highlighted in the screenshot), choosing Show Call Stack on Code Map from the Debug menu, or pressing Ctrl+Shift+` if you’re using the default keyboard mappings.
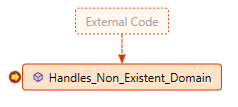
Visual Studio will now split the document window and display a second document pane with the code map in it. Initially the code map will looks like this:
Not very interesting, right? Don’t worry, it gets better. Let’s start stepping into various methods to see how this test works.
Stepping Deeper
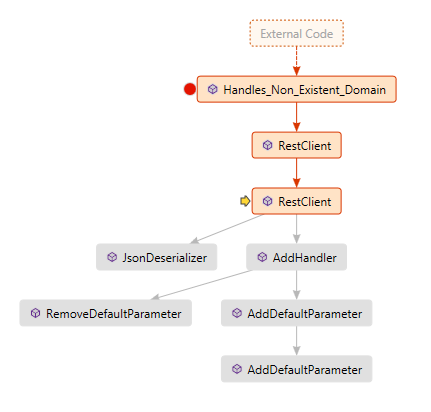
Press F11 to step into the RestClient constructor. As you do, you will notice the code map updating. Continue to step through the code until the first call to AddHandler() has completed. Your Code Map should now show something like the following:
Note that as we step back up the call stack that the colours of nodes in the Code Map change to reflect that methods we have called but that are no longer in the call stack. It helps us keep track of where we’ve been, not just where we are now. This is kinda cool. I no longer have to mentally keep this tree in my head, and can focus more on what the code is doing rather than where I’ve been and which methods might be relevant later on.
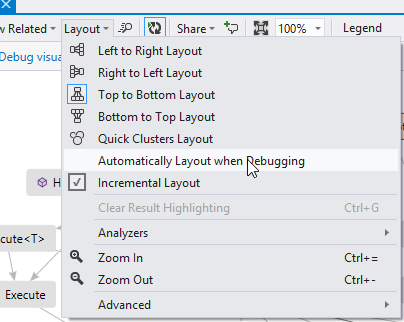
Depending on your resolution, you may also start noticing the zoom level on your Code Map keeps resetting. If you want it to use a specific zoom value then go to the layout options and turn off “Automatically Layout when Debugging”
What Happens When You Skip Over Methods?
The code map only updates when execution pauses. It means that if you step over methods the Code Map will not show you what happened in the code you stepped over. It also means that if you use multiple breakpoints and after hitting the first breakpoint continue execution until you hit the next one, then the Code Map will only reflect the call stack from when the breakpoints were hit. You won’t see anything related to what happened in between breakpoints.
It helps keep the noise in the map down, and presumes that if you’ve skipped over code you’re also not interested in seeing it in the map. That seems to be a reasonable assumption to me.
Anyway, let’s get back to the test we were stepping through and continue execution until we get to the line that calls the Client.Execute() method.
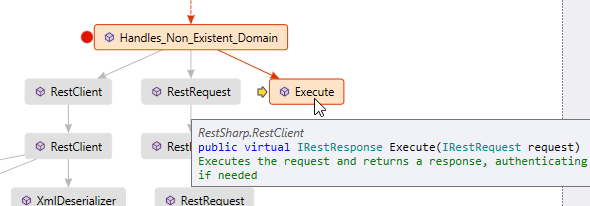
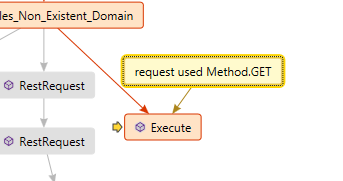
As you step into the method the Code Map will update. Look at the tooltip for the newly added node and you will see details of the method itself based on XML Doc comments, as shown:
This can be handy when you’re deep within the bowels of something and can’t remember exactly how you got to where you are or which specific overload of a method was called.
If we then step into the switch statement, we see that we’re passing in a value of Method.GET. It might be handy to remember that; especially as both parts of the switch statement call Execute(). We can make a note of that on the Code Map by right clicking the node and selecting Add Comment (or hitting Ctrl+Shift+K)
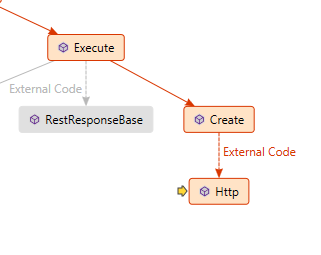
At various point you’ll notice that the some calls go through external code first. The code map will reflect this when it occurs by marking the fact on the call stack arrow, as shown.
Way Down Deep
If you continue to step through the code you will eventually get to the RestSharp.Http.GetRawResponse() method and your Code Map will start to look somewhat busy, as follows:
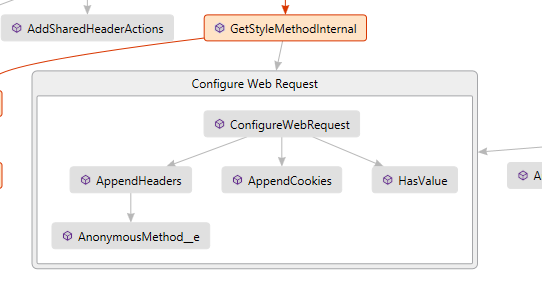
A lot of the nodes in the Code Map are not that interesting now that we’ve stepped through things and are improving our understand of how it fits together. It’s fast becoming noise. To organise the map better we could simply select nodes we’re not interested in anymore and delete them or we can choose to group them by selecting a few, hitting the mouse right-click context menu and choosing Add Parent Group, to get something like the following:
We can then simply collapse groups to hide items we’re not really interested in at the moment.
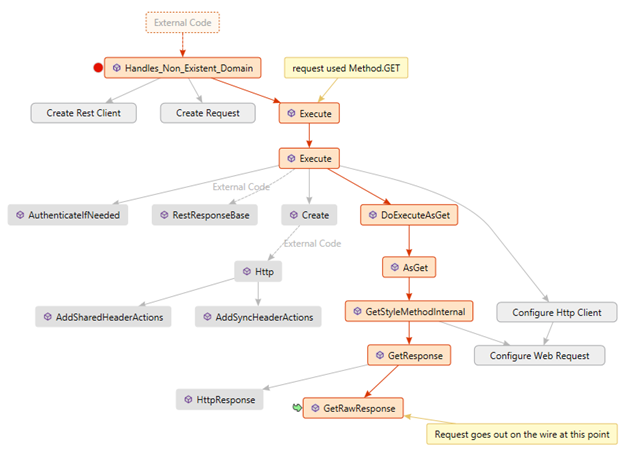
With a little bit of judicious grouping I produced a Code Map as follows and now I have something that helps me better navigate the internals of RestSharp and get familiar with it.
Wrapping it Up
I can add to this map over time as I explore the code further and step through other tests to see how it works, I can also get a feel for which parts of the code are called often and what happens in those methods.
If I wished I could also save the code map and share it with the rest of team, or grab an image of it and post it in the team wiki for documentation purposes or put it on the wall as a reference.
While Code Maps might seem a little gimmicky at first, I’m finding them fast becoming an useful tool in helping me better understand code I’m wading through and in improving my knowledge of what exactly is happening when I’m using an application.
Give Code Maps a try (assuming you have a copy of Ultimate) and see what you think.
